The data comprises 1-minute intervals for 44 symbols over a period of 2,590 trading days (between 2012 and 2022). The total number of days from all stocks that have data is 94,438 (which is 83% of trading days due to missing data, e.g., stocks that were not in existence during the entire period). The total number of intervals (1-minute intervals, each containing price, bid and ask OHLC) is 626,123,940.
When dealing with market data that is obtained from any source, it is important to understand the precision of the price data for two reasons. The first is that sometimes, comparisons between prices are needed to assign a probability to certain events. For example, to predict whether a buy limit order will be filled, the low price of the next time interval needs to be compared to the limit price of the order. Further, the comparison may need to conclude if the limit price will be reached, indicating a probability of execution, or crossed (i.e., the low price unmistakably reached below the limit price) indicating definite execution (with some unrelated caveats). The second reason has to do with data representation which has implications on the amount of storage needed (both in memory and on disk) as well as processing time. The possible choices are usually 32-bit vs 64-bit and integer vs floating point.
Although sub-penny quoting is not allowed by the SEC for orders above $1, it does not prevent trades from happening at any price. It is therefore expected to see open, high, low, close (OHLC) prices that are not multiples of $0.01. Bid and ask OHLC prices, however, are expected to be multiples of $0.01.
In this post, I will explore the precision characteristics of stock price data that was obtained from a market data vendor and derive suitable data representation for it.
Let us plot a histogram of the sub-penny values, with bin width of $0.00001 (1/1000th of a penny).
Code
# ohlc has shape (n_days, 3, 4): (n_days, [price,bid,ask], [open,high,low,close])
fracs = np.modf(ohlc*100.0)[0]/100.0 # keep only sub-cent fractions
# can also be done like this:
# _,w = np.modf(ohlc*100.0)
# fracs = ohlc - w/100.0
samples, step = np.linspace(start=0,stop=.01,num=1001,endpoint=True, retstep=True)
bins=np.concatenate((samples-step/2, [samples[-1]+step/2]))
# these bins have a .0001 width (x±.00005 where x is any multiple of .0001 between 0 and .01)
# bins can also be set to just the value 1001 (which causes them to be computed automatically)

fig=plt.figure(figsize=(10,6))

def hist_plot(ax, arr):
    ax.hist(arr.flatten(), bins=bins, histtype='step', linewidth=.5, log=True)
    # start below 1.0 so even a count of 1 shows up; show all powers
    ax.set_ylim(bottom=0.1)
    ax.yaxis.set_major_locator(matplotlib.ticker.LogLocator(numticks=20))
    ax.grid(axis='y')
    # set x tickmarks every .0001
    ax.xaxis.set_minor_locator(matplotlib.ticker.MultipleLocator(.0001))
    ax.xaxis.set_major_locator(matplotlib.ticker.MultipleLocator(.001))

# price histogram
ax=fig.add_subplot(211)
hist_plot(ax, fracs[:,0,:])
ax.set_title('Price histogram')

# bid/ask histogram
ax=fig.add_subplot(212)
hist_plot(ax, fracs[:,1:,:])
ax.set_title('Bid/ask histogram')

plt.tight_layout()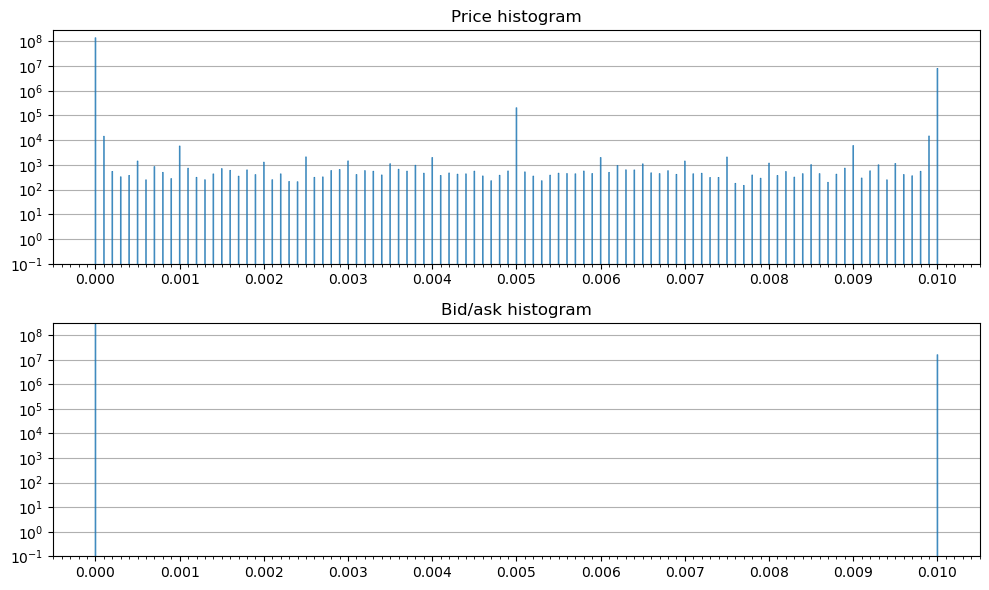
Two observations can be made from the histograms. First, the prices occur (even if rarely sometimes) at 0.0001 intervals (1/100th of a penny). We know this because the histogram has 10 times more bins and all but those 101 are empty. Second, the bid/ask prices, as expected, are multiples of $0.01. We also see that the bin surrounding $0.01 is nonempty which means that the prices may have some numeric precision fluctuation around their expected discrete values. But this is likely introduced in the process of extracting the sub-penny fractions. To verify that, we can compare the original data to its rounded (to 4 decimals for price and to 2 decimals for bid/ask) version:
# price
print(np.array_equal(ohlc[:,0,:], np.round(ohlc[:,0,:], decimals=4)))
# bid/ask
print(np.array_equal(ohlc[:,1:,:], np.round(ohlc[:,1:,:], decimals=2)))
True
TrueLet’s talk about data representation. The data source is 64-bit floating point and as such, np.float64 numpy arrays will work fine. When comparing two values for reach or cross and strictly cross (from above), the <= and < operators can used respectively. Had there been noise due to numeric precision, the following safer tests (which also work when there is no noise) are guaranteed to work given what we know about the multiple of $0.0001 price precision of this data:
areaches or crossesbfrom above:a < b + 0.00005astrictly crossesbfrom above:a < b - 0.00005
It is not possible, however, to preserve the inherent precision of the data by using 32-bit floating point without making strong assumptions about the maximum price. The following example illustrates this:
print(np.float32(1026.4101)==np.float32(1026.4102))
print(np.float32(1026.41)==np.float32(1026.41005))
True
True32-bit unsigned integer is a viable option if we store the prices multiplied by 10000. Comparisons in this case are also straightforward using the comparison operators. The only limitation is that the maximum representable price is $429,496.7295. This is not a problem for most stocks with the exception of BRK.A.
Conclusions
- The market price data can be sub-penny with a granularity of $0.0001 (1/100th of a penny).
- The bid/ask prices are always multiples of $0.01 (when they are above $1).
- The price data is 64-bit floating point and can be represented as such.
- Representing the price data as 32-bit floating point is not possible losslessly without making strong assumptions about the maximum price.
- 32-bit unsigned integer is lossless and has a much higher representable price ceiling than 32-bit floating point.